Built by an Analyst. Designed for You.
I’m a geospatial analyst with a Master of GIS and a passion for making political data actionable. PoliMaps was born from working inside local elections—where I saw candidates struggle where to target voter outreach.
Every map we create is built on academic-level methodology, precision clustering, and real-world relevance. Whether you're a campaign, consultant, researcher, or advertiser—these maps are for you.
How It Works
Built on Statistics That Matter
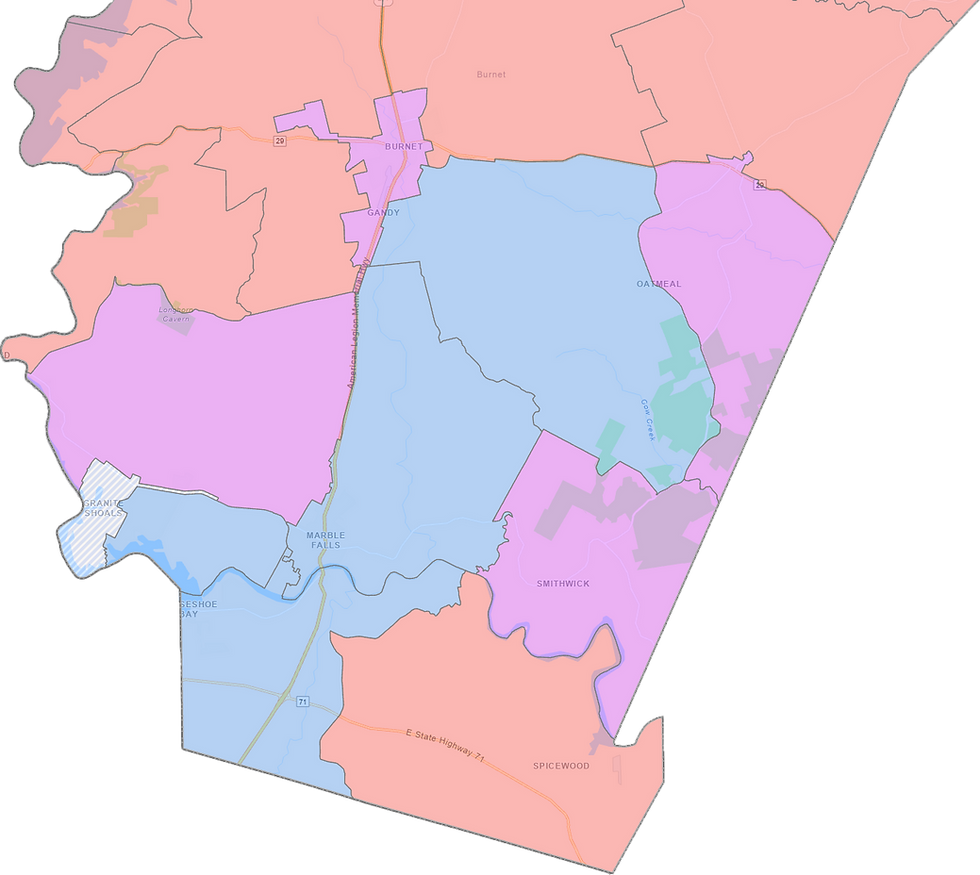
We use Local Moran’s I (LISA) to identify real voter clusters—not just red vs. blue—but stable zones, shifting precincts, and emerging battlegrounds.
See the Data at Work
Our precinct-level maps visualize how political alignment has changed (or held steady) over four presidential elections: 2012, 2016, 2020, and 2024.
Made for Real Campaigns
Built with local candidates in mind. Get access to affordable, university-grade spatial datasets—even if you're running your first race.
From Statewide Trends to Precinct-Level Strategy
Our composite maps provide both the wide view and the fine detail. See entrenched political zones at the state level, then zoom into county-level patterns that reveal micro-shifts invisible on conventional maps.

Statewide Composite Map

County-Level Map